New: seeMote Cube for visionOS Developers - Build physical input for Apple Vision Pro apps. Learn More ›
How to Design and Construct Indoor Air Quality Monitoring System
According to the United States Environmental Protection Agency (EPA), indoor air is 100 times more contaminated than outside air. Most modern populations spend 80 to 90 percent of their time indoors; therefore, indoor air has a greater direct impact on human health than outside air. Moreover, in contrast to atmospheric pollution, indoor pollutants are about 1000 times more likely to be transmitted to the lungs, causing diseases such as multiple chemical sensitivities and dizziness. Indoor air quality management is very important, as it can prevent exposure through proactive precautionary measures. Based on the architecture of the Internet of Things smart home, this article introduces how to design and construct an indoor air quality monitoring system to improve the overall living environment for individuals.

Design and Construct Indoor Air Quality Monitoring System
What is Indoor Air Quality Monitoring?
Indoor air quality monitoring is the process of gathering continuous data on the particles, gasses, and chemicals present in your air. These parameters can include temperature, humidity, carbon dioxide levels, particulate matter, volatile organic compounds (VOCs), and other contaminants. The goal of collecting this data is to identify trends, spot problem areas, and make adjustments accordingly.
Difference between Indoor air quality monitoring and Indoor air quality testing
- Indoor air quality monitoring is continuous or real-time process of gathering IAQ data 24 hours per day, 7 days per week. This is accomplished using IAQ sensors that collect minute-by-minute readings of your indoor air.
- Air quality testing is a one-off occurrence. A professional typically uses a handheld probe, getting a snapshot of the air quality at a single point in time.
What does the Indoor Air Quality Monitoring Monitor?
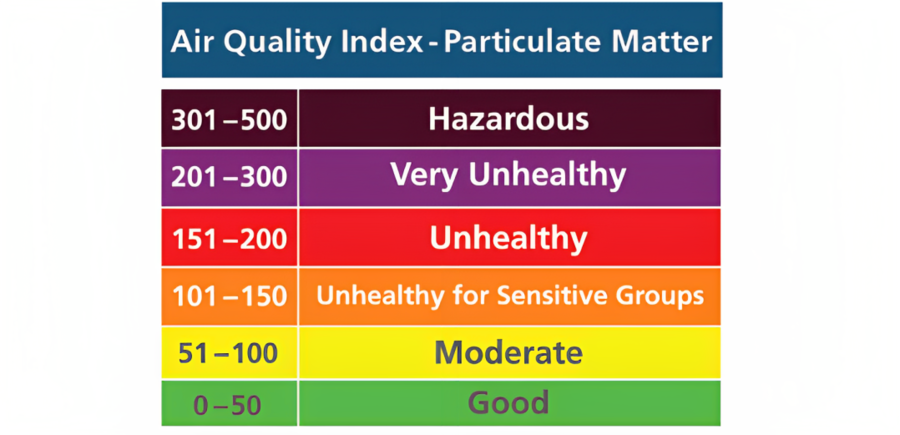
The Air Quality Index (AQI) was developed by the EPA to make it easy to understand the overall air quality of a space. AQI is determined by indoor pollution concentrations and ranges from 0 to 500, or “Good” to “Hazardous”. AQI is now the most commonly used index in the world, and mainly explores 6 gases: ozone (O3), fine particulate matters, particle matters, carbon monoxide (CO), sulfur dioxide (SO2), and nitrogen dioxide (NO2). This article further explored the fine particulate matters, CO, and carbon dioxide (CO2) commonly found in homes.
Indoor Air Pollutant Thresholds
CO2 (400 – 650 ppm)
CO2 is a high-density gas with contents approximately ranging 300–400 ppm in the atmosphere. People produce CO2 with every breath they take, and while CO2 is non-toxic, it may cause hypoxia if its concentration is higher than the general level in the air, which is bad for the human body. The indoor CO2 concentration ranging from 350 to 450 ppm is good, and at a concentration higher than 1000 ppm, people begin to experience symptoms, such as drowsiness, and such higher concentration leads to severe symptoms. Hence, ASHRAE (American society of heating, refrigerating and air-conditioning engineers) suggests that the indoor CO2 concentration should not be higher than 1000 ppm. At higher levels, about 2500 ppm, CO2 can make you sleepy and tired, slow down your brain, and even give you a slight headache. Exposure to levels greater than 5000 ppm can be dangerous to your health.

Effects of CO2 concentration on the human body
CO (400 – 650 ppm)
As a compound, CO is a colorless, tasteless, non-irritating, and odorless gas, and the most common toxic gas in daily life. While the activities of general organisms produce CO, it mainly comes from fire, engine exhaust, and incomplete gas combustion. In the blood, as its heme-binding capacity is 200 times more than that of oxygen (O2), it is difficult for the heme to carry O2 after binding, and after inhaling CO, people will experience various symptoms, such as headaches, vomiting, dizziness, and chest pains. Hence, the United States Environmental Protection Agency (USEPA) stipulated that the maximum CO concentration in the air shall not be more than 10 mg/m3.

Effects of CO concentration on the human body
Particulate Matter (PM2.5): 0 – 12 ug/m3
PM2.5 are often referred to as fine dust and are tiny particles suspended in the air with a diameter of 2.5 micrometers or less. PM2.5 particles are generated from internal activities or outdoor air conditions and can be inhaled deep into the lungs. The average diameter of human hair is 60 μm, which approximately equivalents to six inhalable particulate matter (PM10, <10 μm in diameter, blue color), or twenty-four fine particulate matter (PM2.5, <2.5 μm in diameter, red color) or six hundred ultrafine particulate matter (PM0.1, <0.1 μm in diameter, green color). Particulate matter, with aerodynamic diameter 2.5–10 μm, is mainly deposited on the trachea. PM less than 2.5 μm in diameter poses the greatest problems, because it can get deep into the terminal bronchioles and alveoli, and some with <0.1 μm in diameter may even get into the bloodstream affecting other organs. 10X: The stuff in the dotted ring is magnified ten times.

Effects of PM2.5 concentration on the human body
The World Health Organization (WHO) has established guidelines for PM2.5 levels for the protection of public health. The recommended annual average concentration of PM2.5 is 10 micrograms per cubic meter (μg/m³), while the 24-hour average concentration should not exceed 25 μg/m³.

Effects of PM2.5 concentration
Sources of Indoor Air Pollution
Carbon Dioxide (CO2) in the home
Carbon dioxide (CO2) is an odourless, colourless and non-flammable gas. Common sources of CO in our homes include the following:
- HVAC system
- The fireplace
- Laundry rooms
- Crowded rooms
- Smoking
- Stovetops
- Windowless spaces
- Unmindful new construction
Carbon Monoxide (CO) Sources in the Home
CO is produced whenever a material burns. Homes with fuel-burning appliances or attached garages are more likely to have CO problems. Common sources of CO in our homes include fuel-burning appliances and devices such as:
- Clothes dryers
- Water heaters
- Furnaces or boilers
- Fireplaces, both gas and wood burning
- Gas stoves and ovens
- Motor vehicles
- Grills, generators, power tools, lawn equipment
- Wood stoves
- Tobacco smoke

The average home has 4-6 fuel-burning appliances that produce carbon monoxide (CO)
Identifying CO poisoning can be difficult because the symptoms are similar to the flu. CO is often called the “silent killer” because people will ignore early signs and eventually lose consciousness and be unable to escape to safety. For most people, the first signs of exposure include mild headache and breathlessness with moderate exercise. Continued exposure can lead to more severe headaches, dizziness, fatigue and nausea. Eventually symptoms may progress to confusion, irritability, impaired judgment and coordination, and loss of consciousness.
Particulate Matter (PM2.5) in the home
PM2.5 found indoors includes particles that come from outdoor air and particles that are generated indoors.
- PM from Outdoor Air Pollution
- Cooking
- Combustion and Heating
- Indoor Dust
- Biological Contaminants
- Printers and Copiers

Sources of Indoor Particulate Matter (PM2.5)
What Do You Need to Start Indoor Air Quality Monitoring?
IAQ monitoring typically consist of a combination of hardware and software components that work together to address indoor air quality concerns.
Hardware: sensors, detectors, and monitors track various indoor air pollutants and parameters
Software: analyze and interpret the data collected over time.
An accurate data measurement of indoor air quality is the most important factor for Indoor Air Quality Monitoring. Thus, various types of sensors can be installed or adjusted based on the environment. A microcontroller was installed in the device to gather the data from the sensors and transmit it to the web server using the Wi-Fi module, eliminating the need for a gateway and a data logger.
System Architecture
The system architecture of Indoor Air Quality Monitoring is established based on the concepts of the IoT smart home, and is divided into 4 major parts: Part 1—environmental sensing, Part 2—wireless transmission, Part 3—analysis, and Part 4—load control. The perception layer is the sensing component to collect data using sensors or any measuring devices. The network layer is responsible for transmitting the detected data using a wireless network module. Finally, the presentation layer allows data visualization and storage for efficient monitoring.

System Architecture of Indoor Air Quality Monitoring
Hardware Construction
Regarding environmental sensing, environmental sensors (CO, CO2 and PM2.5) as sensing nodes were set up indoor as well as an infrared emitter, which is used to control the ventilation unit and air purifier. The fine particulate matter sensor (PM2.5) installed next to a window. Arduino UNO, as the micro-controller, is the core architecture of the overall system for indoor air monitoring.
In wireless transmission, after the Arduino board obtained the data, in order to transmit the received data to the computer terminal, the Wi-Fi module was used as the communication bridge for data transmission. Regarding load control, after fuzzy analysis was conducted on the data captured in environmental sensing, the corresponding loads were activated for different values of various data, in order to achieve good indoor air quality. The loads under control were the window, air purifier, and the ventilation unit. When CO increases slightly, the buzzer will be activated first to remind the users to open the window as soon as possible to reduce CO concentration; when the CO2 or fine particulate matters exceed the standard, the Arduino Uno board will activate the ventilation unit and air purifier through the infrared emitter to reduce the concentration.


Indoor environment and locations of sensing nodes
Where to / not to Install Carbon Monoxide Sensors
Where to/not install carbon dioxide sensors
- A carbon dioxide (CO2) sensor is typically installed in a room or area where adequate ventilation is necessary, such as a kitchen or a living room or a garage. The sensor should be placed in an area that is representative of the air quality throughout the room and not near any obstructions that may affect airflow. It is also important to ensure that the sensor is placed at an appropriate height, typically around five feet from the floor. Additionally, the sensor should be installed in accordance with local building codes and manufacturer guidelines to ensure proper operation.
- CO2 sensors should not be installed where they are unnecessary or where CO2 levels are expected to be normal. These locations may include bedrooms, bathrooms or other living areas where people do not spend long periods of time together.
Where to/ not to Install Carbon Monoxide Sensors
- It is recommended to install carbon monoxide sensors in every room of a house that has fuel-burning appliances, such as gas stoves, furnaces, and water heaters. It is especially important to have carbon monoxide sensors installed in bedrooms where people sleep. It is also recommended to install a carbon monoxide sensor in the hallway outside each sleeping area and on every level of the home, including the basement. US like Minnesota state law (MN Statute 299F.50) requires that every home have at least one operational CO alarm within 10 feet of every room legally used for sleeping. All CO alarms should conform to the latest Underwriters Laboratory (UL) Standards.
- Carbon monoxide sensors should not be installed in the following locations: In unventilated or confined areas, such as closets or cabinets. This can cause inaccurate readings and potentially dangerous situations. Near sources of heat or combustible materials, such as near a stove or fireplace. This can also cause inaccurate readings and potentially dangerous situations.
Where to / not to Install PM2.5 Sensor
A PM2.5 sensor should be installed at a location where it can accurately measure the air quality without any interference. Place the sensor at a height of 1-3 meters above the ground level.The sensor should be installed in a location where it can measure the ambient air quality, away from any sources of pollution like factories or heavy traffic. Avoid installing the sensor in direct sunlight or rain as it can affect the accuracy of the measurements.
Recommended CO Sensor:
DFRobot Gravity: Factory Calibrated Electrochemical CO Sensor (0-1000 ppm, I2C & UART)
DFRobot Gravity Sensor adopts the electrochemical principle, has the characteristics of strong anti-interference ability, high stability, high sensitivity, etc., and the service life is as long as two years. The sensor has 32 modifiable I2C addresses, an integrated temperature compensation algorithm, and a threshold alarm function, It has good compatibility with mainstream main control devices such as Arduino, ESP32, and Raspberry Pi. The easy-to-use Gravity interface, coupled with our sample code, can quickly build a carbon monoxide detector.

DFRobot Gravity: Factory Calibrated Electrochemical CO Sensor
Recommended CO2 Sensor:
DFRobot Gravity: I2C SCD41 Infrared CO2 Sensor (400 - 5000 ppm)
This SCD41 CO2 sensor is based on the SCD41 miniature CO2 sensor from Sensirion. SCD41 builds on the photoacoustic NDIR sensing principle and Sensirion’s patented PAsens® and CMOSens® technology to offer high accuracy at an unmatched price and the smallest form factor. SCD41 sensor detects the amount of energy that is absorbed by CO2 molecules. When pulsing the infrared emitter, CO2 molecules absorb infrared light periodically. This causes additional molecular vibration resulting in a pressure wave inside the measurement chamber. The higher the CO2 concentration, the more light is absorbed, and thus the greater the amplitude of this acoustic wave becomes. A microphone inside the gas chamber measures this, from which the CO2 concentration can then be calculated.

DFRobot Gravity: I2C SCD41 Infrared CO2 Sensor (400 - 5000 ppm)
Recommended PM2.5 Sensor:
DFRobot Gravity: PM2.5 Air Quality Sensor
Based on the principle of laser scattering, the PM2.5 air quality sensor employs a digital universal particle sensor that can continuously collect and calculate the number of suspended particles of different sizes in the air per unit volume, which is particle concentration distribution, and then convert to concentration and output via I2C interface.

DFRobot Gravity: PM2.5 Air Quality Sensor
Software Architecture
The software architecture is the indoor node flow chart and the 3 sensors were set in the indoor which returned environmental data to the Arduino Uno board at regular intervals and communicated with each other through Wi-Fi wireless transmission. Among them, the indoor nodes were equipped with the infrared emission module and buzzer, which could receive the results of the computer analysis through fuzzy analysis to determine whether to turn on the air purifier, ventilation unit, or load strength setting, and whether the buzzer gave of warning sounds, in order to further remind the users to pay attention to environmental issues.

This system adopted Visual Studio C# software as the human–machine and monitoring interface, where AQI estimation applied fuzzy control to decide the time to open the air purifer, window, and ventilation unit, in order to reduce the fine particulate matter and CO2 concentrations. The system threshold of CO concentration was designed based on AQI, and the users were reminded by automated warnings and buzzers.

Fuzzy System Architecture
The fuzzy theory is the fuzzy sets mainly covering 4 parts: fuzzy sets, fuzzy logic, fuzzy control, and fuzzy measurement. In this system, defuzzifcation, rule base setting, and fuzzy inference in fuzzy control were used to evaluate the output of the experimental load. Since the number of air detection points is often not too many, that is, the dimensionality of the subsystem is low, the local fusion can be realized by the Classic Vector Kalman Flter Algorithm.

Fuzzy control flow chart

Fuzzy inference
Conclusion
Through this article, we can learn that establishing an indoor air quality monitoring system can not only help us understand indoor air conditions but also improve our standard of living and health. The article introduces common air quality indicators and how to choose the right air quality monitoring sensor for yourself. At the same time, we also have a deep understanding of hardware and software construction solutions, as well as where to install air quality monitoring sensors indoors and other related issues. In practical use, we need to analyze air quality monitoring data in a timely manner, in order to take corresponding measures to change the indoor environment. In conclusion, establishing an indoor air quality monitoring system is crucial for our lives and health, and we should take it seriously.
Reference:
1.Wen Tsai Sung1 and Sung Jung Hsiao, Building an indoor air quality monitoring system based on the architecture of the Internet of Things (2021) https://jwcn-eurasipjournals.springeropen.com/articles/10.1186/s13638-021-02030-1
2.https://www.epa.gov/indoor-air-quality-iaq/indoor-pollutants-and-sources


_400x267.jpg.webp)

Compare six 4K USB cameras using IMX415, IMX274, and IMX678 sensors across resolution, color, field of view, distortion, Linux, and low-light tests.
REVIEWS
This article is an engineering test note, mainly intended to demonstrate the actual performance of the module in common development scenarios, rather than a laboratory calibration report.
REVIEWS
Visit DFRobot at FAB26 Boston for hands-on AI workshops, open-source hardware demos, and practical insights into K–12 maker education.
NEWS