New: seeMote Cube for visionOS Developers - Build physical input for Apple Vision Pro apps. Learn More ›
Make Your Own Arduino Weather Station!

Introduction
This durable arduino weather station kit includes an anemometer, wind vane, rain bucket and DH11 temperature and humidity sensor. It can transmit data via serial or RF interfaces. This tutorial will demonstrate how to assemble the weather station kit, how to set up basic serial communication to an Bluno M3 and how to output data readings through an LCD shield. From this starting point you can take the kit further and add your own ideas.
Required Components


Shopping Links
Bluno M3 - A Arduino STM32 ARM with Bluetooth 4.0
LCD12864 Shield for Arduino
Assembly
Insert pole A in to pole B and place double-arm on top of pole assembly. Secure with a self-tapping screw


Take one single arm and hold up to pole assembly, perpendicular from double arm. Take securing plate and hold to the mating side. Secure together with 4 x M5 machine screws and M5 nuts. Move to desired height before tightening completely.


If you wish to use the RF communication module, you will need to attach the extra arm. Repeat steps as with the first single arm.
Now it’s time to add the sensor modules. First, take the wind vane. Fit it over one of the fittings of the double arm assembly. Place an M3 nut in the recessed hole of the holder, and thread an M3 machine screw through the hole in the opposite end and secure so that the module is firmly attached.

We can fit the anemometer module on the opposite end of the double arm. Just like before, fit the module over the moulded fitting, place an M3 nut in the recess on the assembly, and secure firmly with an M3 machine screw.

There are notches in the underside of the double arm for cable management.
Next, the rain gauge. Place the rain gauge over the single arm fitting and secure from the bottom with a self-tapping screw.


If you wish you may also add the RF transmitter module. This is fitted in the same way as the other modules, by fitting it over the arm’s fitting and threading an M3 phillips head machine screw horizontally through the fitting held on the opposite side with an M3 nut.
(Note: there is no RF receiver included in this kit!)

Next we need to connect cables so that data can be transmitted. The anemometer has the shortest cable. Connect this to the jack in the underside of the wind vane module.


The remaining long cables need to connect to the weather link control board. The cable from the wind vane connects to the “wind” jack on the weather link board (this is screen printed on the PCB next to the jack). The cable from the rain gauge connects to the “rain” jack on the weather link board (again, this is marked on the board).
This concludes the assembly portion of the tutorial. If you like you can tidy up the stray cables with cable ties provided. There are also jubilee clips to secure the weather station to its final place outside, but it is worth waiting until the next few steps are finished before doing this.
The next step is to connect the control board to the microcontroller.
Electronics
Visit the DFwiki page
You will find a sample code that measures the following variables:
• Temperature (C)
• Humidity (%)
• Wind Direction
• Average wind speed per minute (m/s)
• Average wind speed over 5 minutes (m/s)
• Rainfall in 1 hour (mm)
• Rainfall in 24 hours (mm)
• Barometric Pressure (hPa)
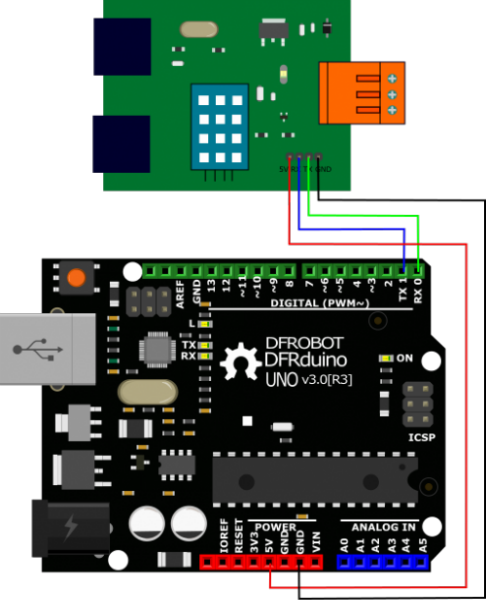
Make the following connections from the Weather Link board to your microcontroller:

Copy and paste the wiki sample code in to the Arduino IDE and then upload it to your microcontroller. You can view the output on the IDE’s serial monitor. Readouts should be printed every half second.
This is fine, but it is inconvenient and unlikely your weather station will be tethered to your computer in use, so let’s add an LCD shield to our setup. Remove all wiring to the microcontroller and then stack the LCD shield on top of it, and then reconnect the wires to the shield as before.

Not only does this shield provide an LCD interface to output data, but it also adds extra I/O pins if you want to add more sensors or actuators.
Now that the LCD shield is in place we need to upload some code that will include it.

Program
If you feel adventurous and want to improve your Arduino C skills, try copying it out line by line.
/*************************************************** DFRobot SEN0186 Weather Station Weather Station + DFRobot LCD Shield *************************************************** This example outputs data from the DFRobot Weather Station kit (SEN0186) to a DFRobot LCD12864 shield (DFR0287) Updated 2016-01-18 By Matt GNU Lesser General Public License. See <http://www.gnu.org/licenses/> for details. All above must be included in any redistribution ****************************************************/ /***********Notice and Troubleshooting*************** For help and info visit the wiki: https://www.dfrobot.com/wiki/index.php?title=Weather_Station_with_Anemometer/Wind_vane/Rain_bucket_SKU:SEN0186 http://www.dfrobot.com/wiki/index.php?title=LCD12864_Shield_SKU:DFR0287 For any other problems, post on the DFRobot forum or email [email protected] ****************************************************/ #include "U8glib.h" //invoke library //LCD U8GLIB_NHD_C12864 u8g(13, 11, 10, 9, 8); // SPI Com: SCK = 13, MOSI = 11, CS = 10, CD = 9, RST = 8 void draw(void) { // graphic commands to redraw the complete screen should be placed here u8g.setFont(u8g_font_trixel_square); //line pixel references #define line1 05 #define line2 12 #define line3 19 #define line4 26 #define line5 33 #define line6 40 #define line7 47 #define line8 55 //column pixel references #define cola 0 #define colb 85 #define colc 110 //Temperature u8g.drawStr(cola, line1, "Temperature:"); u8g.setPrintPos(colb, line1); u8g.print(Temperature()); u8g.setPrintPos(colc, line1); u8g.print("°C"); //Humidity u8g.drawStr(cola, line2, "Humidity:" ); u8g.setPrintPos(colb, line2); u8g.print(Humidity()); u8g.setPrintPos(colc, line2); u8g.print("%"); //Wind Direction u8g.drawStr(cola, line3, "Wind direction:"); //compass directions if (WindDirection() == 0) { u8g.setPrintPos(colb, line3); u8g.print("North"); } else if (WindDirection() == 45) { u8g.setPrintPos(colb, line3); u8g.print("North East"); } else if (WindDirection() == 90) { u8g.setPrintPos(colb, line3); u8g.print("East"); } else if (WindDirection() == 135) { u8g.setPrintPos(colb, line3); u8g.print("South East"); } else if (WindDirection() == 180) { u8g.setPrintPos(colb, line3); u8g.print("South"); } else if (WindDirection() == 225) { u8g.setPrintPos(colb, line3); u8g.print("South West"); } else if (WindDirection() == 270) { u8g.setPrintPos(colb, line3); u8g.print("West"); } else if (WindDirection() == 315) { u8g.setPrintPos(colb, line3); u8g.print("North West"); } //Wind Speed Average/min u8g.drawStr(cola, line4, "Average wind speed/min:"); u8g.setPrintPos(colb, line4); u8g.print(WindSpeedAverage()); u8g.setPrintPos(colc, line4); u8g.print("m/s"); //max wind speed 5 mins u8g.drawStr(cola, line5, "Max wind speed (5 min):"); u8g.setPrintPos(colb, line5); u8g.print(WindSpeedMax()); u8g.setPrintPos(colc, line5); u8g.print("m/s"); //rainfall (one hour) u8g.drawStr(cola, line6, "Rainfall (1 hour):"); u8g.setPrintPos(colb, line6); u8g.print(RainfallOneHour()); u8g.setPrintPos(colc, line6); u8g.print("mm"); //rainfall (24 hours) u8g.drawStr(cola, line7, "Rainfall (24 hours):"); u8g.setPrintPos(colb, line7); u8g.print(RainfallOneDay()); u8g.setPrintPos(colc, line7); u8g.print("mm"); //barometric pressure u8g.drawStr(cola, line8, "Barometric pressure:"); u8g.setPrintPos(colb, line8); u8g.print(BarPressure()); u8g.setPrintPos(colc, line8); u8g.print("hPa"); } char databuffer[35]; double temp; void getBuffer() //Get weather status data { int index; for (index = 0; index < 35; index ++) { if (Serial.available()) { databuffer[index] = Serial.read(); if (databuffer[0] != 'c') { index = -1; } } else { index --; } } } int transCharToInt(char *_buffer, int _start, int _stop) //char to int? { int _index; int result = 0; int num = _stop - _start + 1; int _temp[num]; for (_index = _start; _index <= _stop; _index ++) { _temp[_index - _start] = _buffer[_index] - '0'; result = 10 * result + _temp[_index - _start]; } return result; } int WindDirection() //Wind Direction { return transCharToInt(databuffer, 1, 3); } float WindSpeedAverage() //air Speed (1 minute) { temp = 0.44704 * transCharToInt(databuffer, 5, 7); return temp; } float WindSpeedMax() //Max air speed (5 minutes) { temp = 0.44704 * transCharToInt(databuffer, 9, 11); return temp; } float Temperature() //Temperature ("C") { temp = (transCharToInt(databuffer, 13, 15) - 32.00) * 5.00 / 9.00; return temp; } float RainfallOneHour() //Rainfall (1 hour) { temp = transCharToInt(databuffer, 17, 19) * 25.40 * 0.01; return temp; } float RainfallOneDay() //Rainfall (24 hours) { temp = transCharToInt(databuffer, 21, 23) * 25.40 * 0.01; return temp; } int Humidity() //Humidity { return transCharToInt(databuffer, 25, 26); } float BarPressure() //Barometric Pressure { temp = transCharToInt(databuffer, 28, 32); return temp / 10.00; } void setup() { Serial.begin(9600); u8g.setContrast(0); // Config the contrast to the best effect u8g.setRot180();// rotate screen, if required // set SPI backup if required //u8g.setHardwareBackup(u8g_backup_avr_spi); // assign default color value if ( u8g.getMode() == U8G_MODE_R3G3B2 ) { u8g.setColorIndex(255); // white } else if ( u8g.getMode() == U8G_MODE_GRAY2BIT ) { u8g.setColorIndex(3); // max intensity } else if ( u8g.getMode() == U8G_MODE_BW ) { u8g.setColorIndex(1); // pixel on } else if ( u8g.getMode() == U8G_MODE_HICOLOR ) { u8g.setHiColorByRGB(255, 255, 255); } } void loop() { getBuffer(); //Begin! Serial.print("Wind Direction: "); Serial.print(WindDirection()); Serial.println(" "); Serial.print("Average Wind Speed (One Minute): "); Serial.print(WindSpeedAverage()); Serial.println("m/s "); Serial.print("Max Wind Speed (Five Minutes): "); Serial.print(WindSpeedMax()); Serial.println("m/s"); Serial.print("Rain Fall (One Hour): "); Serial.print(RainfallOneHour()); Serial.println("mm "); Serial.print("Rain Fall (24 Hour): "); Serial.print(RainfallOneDay()); Serial.println("mm"); Serial.print("Temperature: "); Serial.print(Temperature()); Serial.println("C "); Serial.print("Humidity: "); Serial.print(Humidity()); Serial.println("% "); Serial.print("Barometric Pressure: "); Serial.print(BarPressure()); Serial.println("hPa"); Serial.println(""); Serial.println(""); //LCD output u8g.firstPage(); do { draw(); } while ( u8g.nextPage() ); // rebuild the picture after some delay delay(500); }
Code Analysis
#include "U8glib.h" //invoke library
First we need to include the library to control graphics
//LCD U8GLIB_NHD_C12864 u8g(13, 11, 10, 9, 8); // SPI Com: SCK = 13, MOSI = 11, CS = 10, CD = 9, RST = 8
In this line pins are declared that will drive the LCD screen
void draw(void) { // graphic commands to redraw the complete screen should be placed here u8g.setFont(u8g_font_trixel_square);
These lines of code set the font used by the LCD. We have selected the smallest possible one so as to fit all the data on one “page” of the screen. If you want you may change it. A useful reference guide can be found here: https://code.google.com/p/u8glib/
//line pixel references #define line1 05 #define line2 12 #define line3 19 #define line4 26 #define line5 33 #define line6 40 #define line7 47 #define line8 55 //column pixel references #define cola 0 #define colb 85 #define colc 110
In order to place the information on the screen neatly, I have set up pixel references for lines and columns in code. We have 8 lines of text going down the page for each sensor reading, and 3 columns going across the page: column a (cola) for the reading label, column b (colb) for the reading itself, and column c (colc) for the unit of measurement.
The reason I have done this here is that it saves me having to write the pixel number in each line of code, and can instead substitute these. You will see each appear in the next lines of code. //Temperature u8g.drawStr(cola, line1, "Temperature:"); u8g.setPrintPos(colb, line1); u8g.print(Temperature()); u8g.setPrintPos(colc, line1); u8g.print("°C");
This section of code prints the readout for the temperature sensor. The sensor calculations occur later in the code and are referenced.
The drawStr line of code sets the position of text, and then prints the text in inverted commas (Temperature:)
The next line sets the positioning again (colb, line1) for the following line of code.
The next line calls the function Temperature() and prints the output in this space.
The next line prints the unit (C) in column c of line 1.
All of the other readouts behave in much the same way. The only one that varies is the wind direction module: //Wind Direction u8g.drawStr(cola, line3, "Wind direction:"); //compass directions if (WindDirection() == 0) { u8g.setPrintPos(colb, line3); u8g.print("North"); } else if (WindDirection() == 45) { u8g.setPrintPos(colb, line3); u8g.print("North East"); } else if (WindDirection() == 90) { u8g.setPrintPos(colb, line3); u8g.print("East"); } else if (WindDirection() == 135) { u8g.setPrintPos(colb, line3); u8g.print("South East"); } else if (WindDirection() == 180) { u8g.setPrintPos(colb, line3); u8g.print("South"); } else if (WindDirection() == 225) { u8g.setPrintPos(colb, line3); u8g.print("South West"); } else if (WindDirection() == 270) { u8g.setPrintPos(colb, line3); u8g.print("West"); } else if (WindDirection() == 315) { u8g.setPrintPos(colb, line3); u8g.print("North West"); }
The wind direction displays depending on the angle of the wind vane. If we think of the wind vane’s rotational path as a circle of 360 degrees, we can attribute compass directions to these values. North is 0 degrees, East is 90 degrees, South is 180 degrees and West is 270 degrees. For a greater resolution of directions I have also added North East (45 degrees), South East (135 degrees), South West (225 degrees) and North West (315 degrees). If the vane’s rotation is equal to these values, the LCD will serial print the corresponding compass bearing.
This part of the code manages the data calculations:
char databuffer[35]; double temp; void getBuffer() //Get weather status data { int index; for (index = 0; index < 35; index ++) { if (Serial.available()) { databuffer[index] = Serial.read(); if (databuffer[0] != 'c') { index = -1; } } else { index --; } } } int transCharToInt(char *_buffer, int _start, int _stop) //char to int? { int _index; int result = 0; int num = _stop - _start + 1; int _temp[num]; for (_index = _start; _index <= _stop; _index ++) { _temp[_index - _start] = _buffer[_index] - '0'; result = 10 * result + _temp[_index - _start]; } return result; } int WindDirection() //Wind Direction { return transCharToInt(databuffer, 1, 3); } float WindSpeedAverage() //air Speed (1 minute) { temp = 0.44704 * transCharToInt(databuffer, 5, 7); return temp; } float WindSpeedMax() //Max air speed (5 minutes) { temp = 0.44704 * transCharToInt(databuffer, 9, 11); return temp; } float Temperature() //Temperature ("C") { temp = (transCharToInt(databuffer, 13, 15) - 32.00) * 5.00 / 9.00; return temp; } float RainfallOneHour() //Rainfall (1 hour) { temp = transCharToInt(databuffer, 17, 19) * 25.40 * 0.01; return temp; } float RainfallOneDay() //Rainfall (24 hours) { temp = transCharToInt(databuffer, 21, 23) * 25.40 * 0.01; return temp; } int Humidity() //Humidity { return transCharToInt(databuffer, 25, 26); } float BarPressure() //Barometric Pressure { temp = transCharToInt(databuffer, 28, 32); return temp / 10.00; }
The setup function runs once when the program initializes:
void setup()
{
The baud rate is set. This is used for serial communication:
Serial.begin(9600);
Then the LCD settings are declared, such as the constrast, default colour value, etc.:
u8g.setContrast(0); // Config the contrast to the best effect u8g.setRot180();// rotate screen, if required // set SPI backup if required //u8g.setHardwareBackup(u8g_backup_avr_spi); // assign default color value if ( u8g.getMode() == U8G_MODE_R3G3B2 ) { u8g.setColorIndex(255); // white } else if ( u8g.getMode() == U8G_MODE_GRAY2BIT ) { u8g.setColorIndex(3); // max intensity } else if ( u8g.getMode() == U8G_MODE_BW ) { u8g.setColorIndex(1); // pixel on } else if ( u8g.getMode() == U8G_MODE_HICOLOR ) { u8g.setHiColorByRGB(255, 255, 255); } }
The loop function runs infinitely, or until the microcontroller is powered off or a component fails.
In this program the loop mainly handles printing data to the Arduino IDE using the Serial.print function. It also refreshes the LCD every half second (500 milliseconds):
void loop() { getBuffer(); //Begin! Serial.print("Wind Direction: "); Serial.print(WindDirection()); Serial.println(" "); Serial.print("Average Wind Speed (One Minute): "); Serial.print(WindSpeedAverage()); Serial.println("m/s "); Serial.print("Max Wind Speed (Five Minutes): "); Serial.print(WindSpeedMax()); Serial.println("m/s"); Serial.print("Rain Fall (One Hour): "); Serial.print(RainfallOneHour()); Serial.println("mm "); Serial.print("Rain Fall (24 Hour): "); Serial.print(RainfallOneDay()); Serial.println("mm"); Serial.print("Temperature: "); Serial.print(Temperature()); Serial.println("C "); Serial.print("Humidity: "); Serial.print(Humidity()); Serial.println("% "); Serial.print("Barometric Pressure: "); Serial.print(BarPressure()); Serial.println("hPa"); Serial.println(""); Serial.println(""); //LCD output u8g.firstPage(); do { draw(); } while ( u8g.nextPage() ); // rebuild the picture after some delay delay(500); }
This is the end of the code!
Conclusion
This tutorial has covered basic operation of the weather station kit. By using this kit and recording the data you can learn a lot about weather patterns and meteorology, but there is plenty of scope for improvement: how about adding a PM2.5 sensor to the array of sensors to monitor air pollution? How about setting up an RF receiver so that the weather station can transmit data wirelessly via the RF transmitter? How about adding a data logger module to the microcontroller so that you can log weather patterns over time?
Here are some Taobao links if you would like to try and implement your own RF receiver module for wireless transmission of data:
APRS interfaces
https://item.taobao.com/item.htm?spm=a1z10.5-c.w4002-5392156393.20.qGPvoM&id=39788803312
https://item.taobao.com/item.htm?spm=a1z10.5-c.w4002-5392156393.23.qGPvoM&id=23222648797
If you have enjoyed this arduino weather station kit or if you have any suggestions for improvements, why not drop us a message on the DFRobot forum? http://www.dfrobot.com/forum/
Here you can showcase your projects and gain exposure to a worldwide community of engineers and hobbyists who can offer help and advice to improve your projects.
We hope you enjoyed this tutorial.

Compare six 4K USB cameras using IMX415, IMX274, and IMX678 sensors across resolution, color, field of view, distortion, Linux, and low-light tests.
REVIEWS
This article is an engineering test note, mainly intended to demonstrate the actual performance of the module in common development scenarios, rather than a laboratory calibration report.
REVIEWS
Visit DFRobot at FAB26 Boston for hands-on AI workshops, open-source hardware demos, and practical insights into K–12 maker education.
NEWS